Difference between revisions of "Example two: Assessing a drought feeding option"
| (7 intermediate revisions by the same user not shown) | |||
| Line 35: | Line 35: | ||
It can be seen that at a feeding cost of $450 per head for the breeders, the option would most likely be to sell the cows and buy back cows and calves a year later. At feeding costs of $400 per head or lower the possible option would be to hold the breeders and feed them. The breakeven level for the feeding exercise is about $433 for feed inputs per cow. Being able to sell the PTIC cows now for more or purchase the cows and calves back in 12 months for a lower costs will significantly reduce the amount that can be spent on feeding the cows. | It can be seen that at a feeding cost of $450 per head for the breeders, the option would most likely be to sell the cows and buy back cows and calves a year later. At feeding costs of $400 per head or lower the possible option would be to hold the breeders and feed them. The breakeven level for the feeding exercise is about $433 for feed inputs per cow. Being able to sell the PTIC cows now for more or purchase the cows and calves back in 12 months for a lower costs will significantly reduce the amount that can be spent on feeding the cows. | ||
| − | [[file:Cowtrade_ex2_3.JPG|center|frame|Figure 3 - Cowtrade results output]] | + | [[file:Cowtrade_ex2_3.JPG|center|frame|Figure 3 - Cowtrade results output for break even feeding cost]] |
| − | [[file:Cowtrade_ex2_4.JPG|center|frame | + | [[file:Cowtrade_ex2_4.JPG|center|frame|Figure 4 - Cowtrade results summaries (for a larger image follow the example in the online tool]] |
The results of the analysis can be further tested for their sensitivity to sale price increments in the section at the very bottom of the web page, below the calculators section. | The results of the analysis can be further tested for their sensitivity to sale price increments in the section at the very bottom of the web page, below the calculators section. | ||
Latest revision as of 05:05, 1 September 2020
Copy the example scenario (Cowtrade drought feeding cows and calves) from the examples list and open the scenario, this will illustrate how the program may be used in the following example.
Note: The yellow cells are for inputs and can be adjusted, while the rest are calculated outputs.
The Cowtrade program allows for the input of Standard weight of one Adult Equivalent and Extra Adult Equivalents for cow weaning a calf, the default values being 455kg and 0.35 respectively, see figure 1. One Adult Equivalent is a non-lactating animal of average 455kg liveweight carried for a year. It is generally unnecessary to change these values unless the user is using a different Adult Equivalent convention for comparing grazing pressure and they wish to tailor it to their requirements. If the analysis period is less than the duration of pregnancy plus five months, a proportional value for the adult equivalent rating of the calf is calculated.
Example two describes how to use this program when a grazier is faced with the difficult decision of whether to hold or sell breeders going into a drought.
Some key assumptions must be made in order to do this:
- What is the breeder unit worth (net of selling expenses) now? This could be a cow and calf unit that will need to be fed for a considerable period if it is retained in the herd until weaning time.
- What will the breeder unit be worth at the end of the period? This could be at the expected time of the drought breaking (end of the feeding period) or the weaner being sold off the mother or the time that the cow and calf unit will be replaced.
- How much will it cost to retain the breeder unit over this period?
Scenario: The grazier is running out of feed for a group of PTIC cows and can either sell them now (01/07/2020) for $811 per head net or hold them and feed them. If they are sold, the decision would be to replace the breeder units with cow and calf units in about June the following year. The calves are likely to be close to weaning age at this time. The expected landed replacement cost is $1316 ($811 +$505).
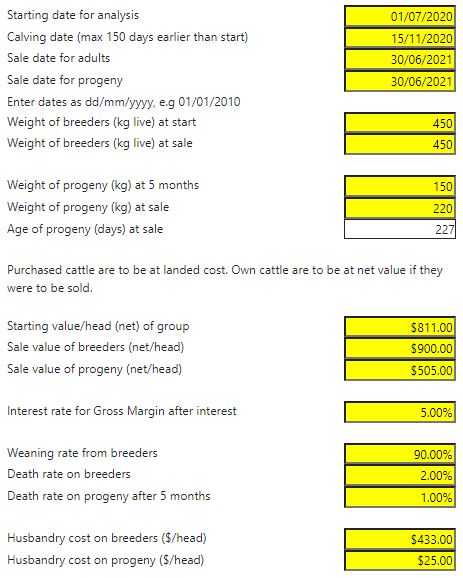
The steps below take the user through the data entry for this scenario displayed in Figure 2.
- Begin by entering the Start date for the analysis (01/07/2020), Expected calving date (15/11/2020), expected future Sale date for adults, Sale date for progeny (these are both to be 30/06/2021), Weight of breeders at start and sale (450kg), Weight of progeny at 5 months and sale (150 & 220kg). Sale can be either a normal sale, or a transfer at valuation of weaner or breeder back into the herd. These dates and weights are used mainly to calculate adult equivalents.
- When entering the Starting value/head of group for a destocking analysis assessing breeders already in the herd, the net value that would be achieved if that animal were to be sold should be used, there are calculators in the Cowtrade program which will help the user calculate these values, they are located below the scenario summaries in the web page.
- Sale values may be entered as per head net values, or may be calculated from weights, price per kilogram and selling and transport costs using the calculators at the bottom of the web page. Explanation and examples for the use of the calculators can be found in the Cowtrade calculators page.
- Enter the Interest rate for Gross Margin after interest (5%), this should be viewed as the opportunity cost, especially if using business funds rather than borrowed funds.
- Enter the appropriate Weaning rate from breeders (90%) and Death rate (2% breeders, 1% progeny) on stock classes.
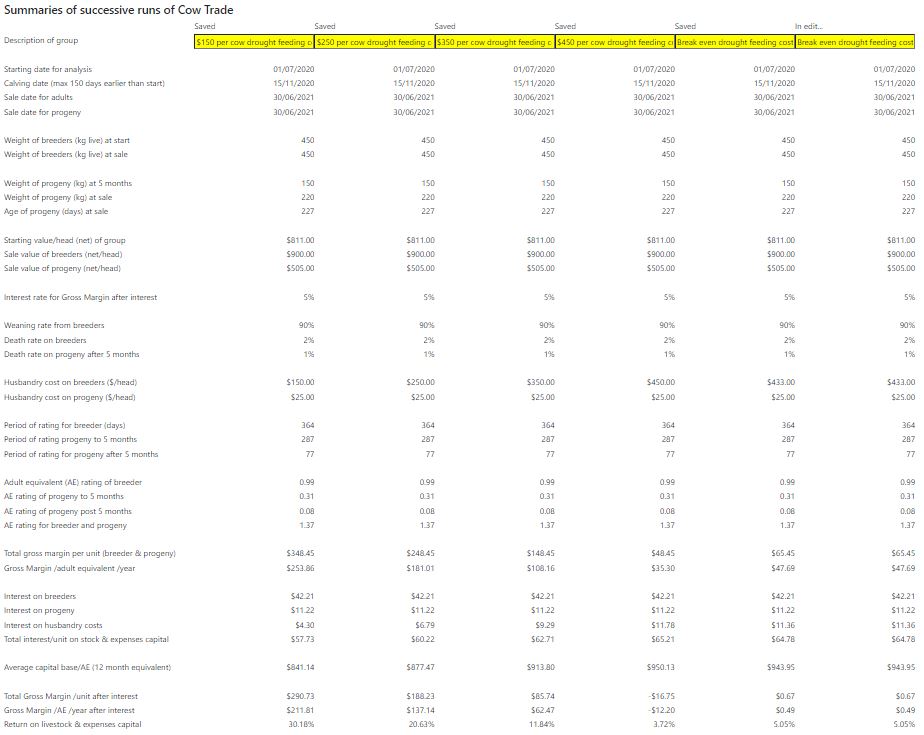
- Enter expected Husbandry cost for the stock classes based on the duration of the analysis. In this case the husbandry cost is predominantly the drought feeding costs over the time held. There are multiple scenarios tested with different feeding eventualities including $150, $250, $350 and $450 on breeders with $25 on progeny.
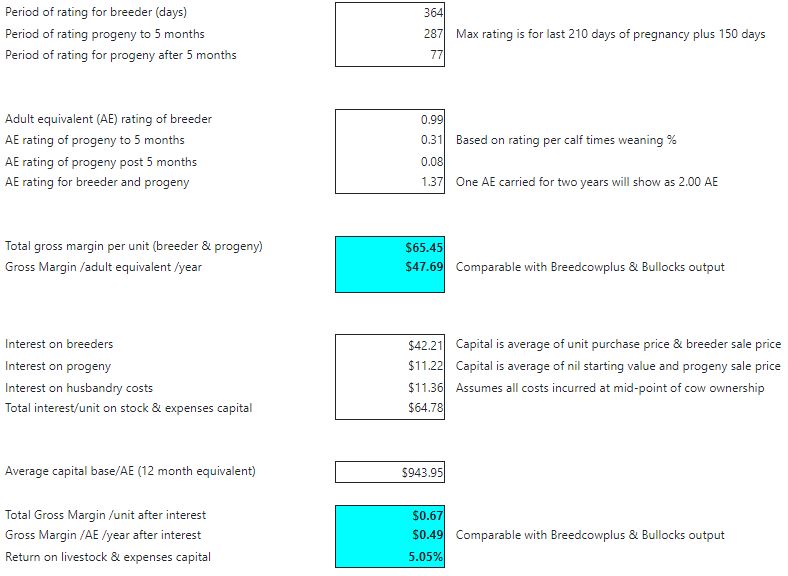
The results of the analysis, as displayed in Figure 3 and Figure 4, can be found to the right of the yellow input cells and summarised in columns below the inputs section on the web page. The results can be saved by clicking the Save button at the bottom of the summary column and renamed by typing in the yellow box beside description of the group.
The figure calculated for the Gross margin per AE after interest is the most likely indicator of the success of the feeding venture or not. If it is positive, it suggests holding the cows and feeding them will be less costly to the property than selling the PTIC cows and trying to buy them back as cows and calves once the drought has broken. It can be seen that at a feeding cost of $450 per head for the breeders, the option would most likely be to sell the cows and buy back cows and calves a year later. At feeding costs of $400 per head or lower the possible option would be to hold the breeders and feed them. The breakeven level for the feeding exercise is about $433 for feed inputs per cow. Being able to sell the PTIC cows now for more or purchase the cows and calves back in 12 months for a lower costs will significantly reduce the amount that can be spent on feeding the cows.
The results of the analysis can be further tested for their sensitivity to sale price increments in the section at the very bottom of the web page, below the calculators section.
Follow these links for more examples of using Cowtrade:


