Difference between revisions of "Splitsal assumptions"
| Line 25: | Line 25: | ||
===Annual live weight gain=== | ===Annual live weight gain=== | ||
| + | This refers to the expected weight an animal will gain in one year of growth. | ||
| + | |||
| + | When using annual live weight gain in a short term trading scenario, it is important to think of when the most growth is expected i.e. this may be during the wet season when pasture growth is most active. For example a 6 month trade of a mob of steers held on the property from December to May (wet season) could be expected to grow more than a 6 month trade held from June to November (dry season). Therefore annual weight gain from pasture is not distributed linearly across the months of the year. For more information on understanding animal growth paths go to | ||
Revision as of 03:14, 17 August 2020
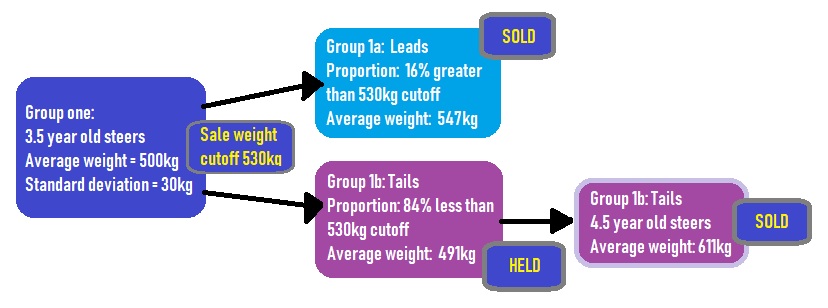
The Splitsal program is a calculator for livestock turnoff at two ages. Quite often in extensive beef herds one age group of steers will be sold at different ages, once the desired proportion of the whole group has reached the target turnoff weight this lead group would be sold in a first draft. The remainder or tail group would then be held for another wet season and sold as the tail group around a year later. Splitsal is able to estimate average turnoff weights at each age for a mob under the same or different growth patterns.
The Splitsal program is based on the assumption that the distribution of weights in the turnoff group is a normal distribution. A normal distribution is defined by the mean (average) and standard deviation (SD) of a group.
Average (mean)
The average is a measure of central tendency for a population or sample. It is the sum of all the numbers divided by the number of values being summed or the size of the population or sample. For example: The average weight of a mob of cattle would be determined by adding together the weights of all the individual animals, then dividing this number by the total number of animals in the mob.
Standard deviation (SD)
Normal distribution
Splitsal generates a normal distribution of weights, based on the mean and standard deviation of a group. From this distribution the percent of the mob above and below a cutoff weight and the average weights of these two groups are estimated, see in Figure 1 below.
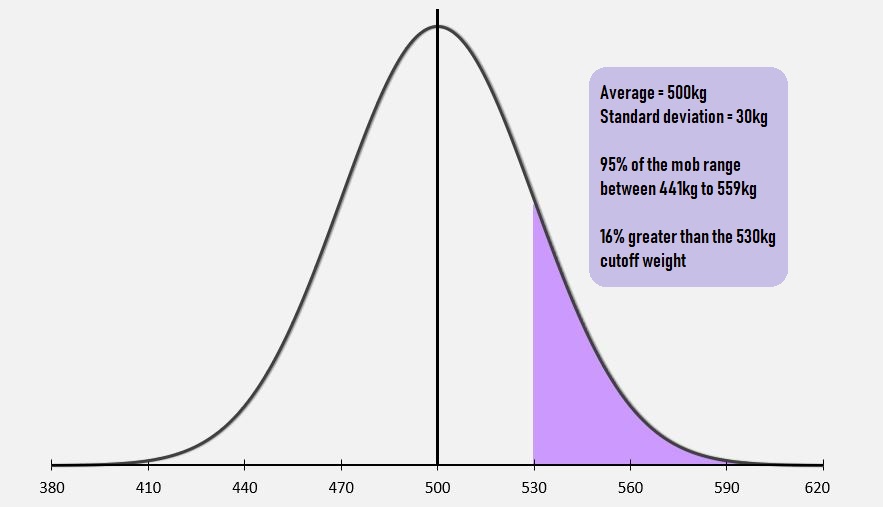
In a normal distribution, 95 percent of the observations (weights) lie within 1.96 standard deviations of the mean. The Splitsal program displays this range and users can look at these ranges to judge if the standard deviation should be increased or decreased to make the range fit their situation.
Please note that in a normal distribution, the distribution each side of the mean is the same. The curve of distributions is bell-shaped with each side a mirror image of the other. If a group of turnoff cattle does NOT fit this distribution, then SPLITSAL will NOT give reasonable estimates of turnoff proportions and weights. For a graphical representation of the normal distribution described in Figure 1, see Figure 2 below.
Once the lead or the tail off the mob has been removed, the distribution, if originally “normal” can no longer be “normal”. Thus the Splitsal program applies only to a mob which has not previously had a cut taken out of it (other than perhaps a random cut).
The Splitsal program might also be used to estimate proportions of heifers reaching puberty at a particular age under different growth rate regimes, where the cut-off weight is used to represent expected weight at puberty.
Annual live weight gain
This refers to the expected weight an animal will gain in one year of growth.
When using annual live weight gain in a short term trading scenario, it is important to think of when the most growth is expected i.e. this may be during the wet season when pasture growth is most active. For example a 6 month trade of a mob of steers held on the property from December to May (wet season) could be expected to grow more than a 6 month trade held from June to November (dry season). Therefore annual weight gain from pasture is not distributed linearly across the months of the year. For more information on understanding animal growth paths go to

