Difference between revisions of "Growth Path"
| Line 10: | Line 10: | ||
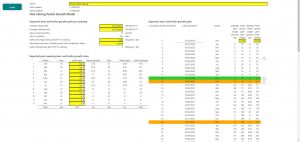
[[File:GrowthPathWiki.jpg|frameless|Figure 1 - Growth Path Default Screen]] | [[File:GrowthPathWiki.jpg|frameless|Figure 1 - Growth Path Default Screen]] | ||
| − | + | ===Entering the data=== | |
Step 1: The "One Calving Period Growth Model" | Step 1: The "One Calving Period Growth Model" | ||
| Line 29: | Line 29: | ||
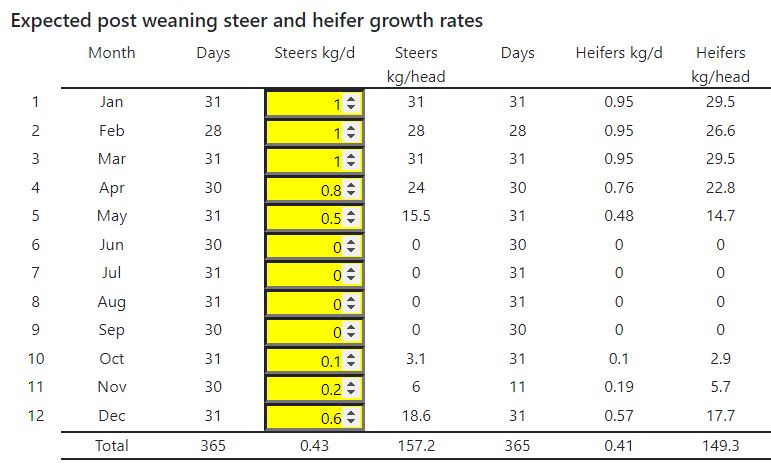
[[File:LWG.JPG|centre|frame|Figure 3 - Average Daily Liveweight Gain by month]] | [[File:LWG.JPG|centre|frame|Figure 3 - Average Daily Liveweight Gain by month]] | ||
| + | |||
| + | ===Reading the results=== | ||
Revision as of 00:02, 19 August 2020
The Growth Path tool is guide that helps you visualise and estimate the weights of your cattle at certain ages. This will assist you in filling out the Breedcow+ AE Calc and the Dynama+ AECalc sheets. It's also very hand in the Bullocks tool.
Important! The Growth Path tool does not automatically fill out the AE Calc sheets.
How to use the Growth Path tool
Upon entering the Growth Path page, the following screen should be displayed. It has some example values - but these won't necessarily match yours.(Hint: Click the picture to make it bigger!).
Entering the data
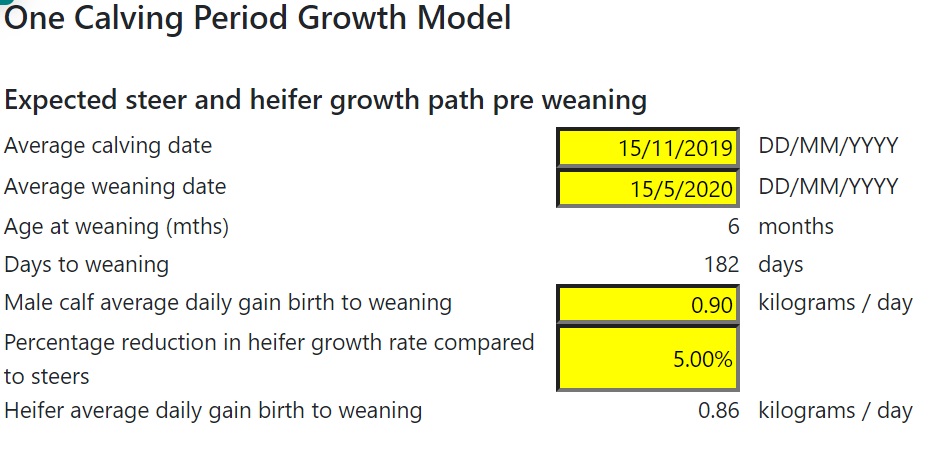
Step 1: The "One Calving Period Growth Model"
Firstly, forget the words "One Calving Period Growth Model". Think of the model as the ability to forecast a growth path for an individual animal and then use the forecast to assist in filling out AECalc. Next, think of your weaner mob as an average, individual animal.
For instance, what date would the "average" weaner in your herd be born? If you joined the bulls in January, and approximately 50% of your cattle were pregnant by March, in 9 months time you will have 50% of your calves! So we might expect average calving date to be sometime in December. In this example, we expect that to be 15/12/2019. Weaning date is typically the date when you wean - if you do several rounds of weaning - think about the "average" weaner.
The next yellow box "Male calf average daily gain birth to weaning" is used mostly so that our weaning weight is about right for our herd. We can check that a little later on.
The last yellow box in section 1 is "Percentage reduction in heifer growth rate compared to steers" - typically we use about 5%, however, if you have great data on this, feel free to change it.
Step 2: Average daily livewieght gains by month.
Using the arrows, or entering directly into the cell, add in your average liveweight gains you expect in the varies months. For instance, in the following image (Figure 3), we expect the cattle to put on 1kg per day during January, February and March. So we add 1 to each of those months. For each month, add in your expected, or average, liveweight gains.


