Difference between revisions of "Dynama+ Dynama"
(Replaced content with "==Step 5 Complete the Dynama worksheet== The Dynama worksheet automatically takes values from the Dynama+ AECalc, Prices and Dynam...") Tag: Replaced |
|||
| Line 9: | Line 9: | ||
===Data Tables 1 to 6 - Deaths, Calving and Prices=== | ===Data Tables 1 to 6 - Deaths, Calving and Prices=== | ||
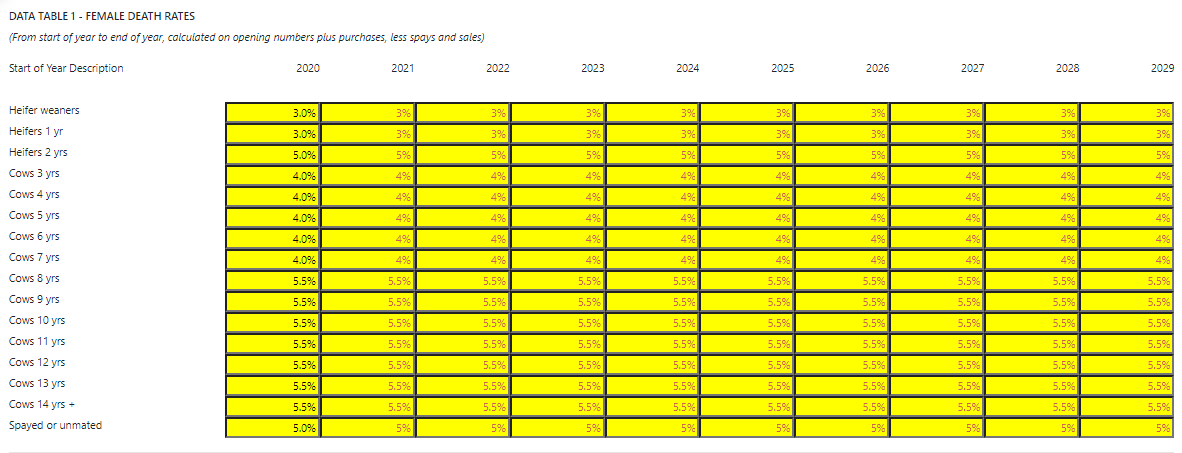
The first four data tables in the Dynama worksheet only require entries for the first year if values are expected to remain the same over time. Year one are normal data entry cells (black text). Years two to ten are automatically generated (red-brown text) and allow new entries to be over typed. These formulas copy the initial values to the second and subsequent years in each table but may be overridden with value entries if later years are expected to have different values to the first year. | The first four data tables in the Dynama worksheet only require entries for the first year if values are expected to remain the same over time. Year one are normal data entry cells (black text). Years two to ten are automatically generated (red-brown text) and allow new entries to be over typed. These formulas copy the initial values to the second and subsequent years in each table but may be overridden with value entries if later years are expected to have different values to the first year. | ||
| + | |||
| + | [[file:Data Table 1.PNG|frame|center|Female death rates table from Dynama worksheet.The values entered for annual death rates are automatically copied to the remaining years of the program unless they are overwritten. The values shown for death rates are the same as those used in the Breedcow+ example file.]] | ||
Revision as of 05:19, 18 August 2020
Step 5 Complete the Dynama worksheet
The Dynama worksheet automatically takes values from the Dynama+ AECalc, Prices and Huscosts worksheets and combines them with data about births, losses, sales and purchases to build a ten year sequence of livestock schedules.
A livestock schedule (Dynama HERD TABLE 7) provides a snapshot of the structure and productivity of a cattle herd for up to a decade.
Once the performance of the cattle business has been identified in the livestock schedule, the Dynama worksheet connects its cattle trading outcomes to cost, asset and loans input to project cash flow, net income, debt and net worth.
Data Tables 1 to 6 - Deaths, Calving and Prices
The first four data tables in the Dynama worksheet only require entries for the first year if values are expected to remain the same over time. Year one are normal data entry cells (black text). Years two to ten are automatically generated (red-brown text) and allow new entries to be over typed. These formulas copy the initial values to the second and subsequent years in each table but may be overridden with value entries if later years are expected to have different values to the first year.
