Cowtrade
The Cowtrade program is used to calculate the prospective profitability of breeder groups (i.e. some of them will no yet have or already have calves) while the Bullocks program is used to calculate the prospective profitability for groups of steers and empty cows or heifers. The Cowtrade and Bullocks programs can also assist with decisions where sales are forced by drought or a variety of other circumstances. It is usual to limit a cow trade or bullocks analysis to the short term, usually for a period up to 12 months.
Note: The Cowtrade program (and its companion program Bullocks) do not use data from or directly contribute data to any other Breedcow+ and Dynama+ program.
- When buying cattle to fatten or grow out, it is logical that the most profitable options are the ones to choose. The profitability criterion for choosing between fattening or growing opportunities is nearly always the gross margin per adult equivalent after interest. If finance is tight to the degree that the feed cannot be completely stocked, then the gross margin expressed as a percent of herd and expenses capital is a more satisfactory criterion. The Cowtrade and Bullocks programs calculate both these measures of profitability.
- If selling stock to reduce grazing pressure or to relieve financial pressure, the object should be to achieve the grazing or financial objective with least damage to future income. If the issue is grazing pressure, sell first those groups with the lowest gross margin per adult equivalent after interest. If the issue is financial, sell first those groups with the lowest percent return on livestock and expenses capital.
- For explanation of the additional calculators within Cowtrade go to the Cowtrade calculators page.
Using the Cowtrade program
The program is located with the [Breedcow and Dynama Software], within the Tools tab, which can be accessed after registering or logging in to use the free software.
- A new scenario can be created by clicking the Save button beside a blank yellow name bar and can be named by typing in the yellow bar. This scenario or previously created scenarios can be edited by clicking the Open button.
- To open an example scenario click the Copy button beside the example scenario and it will be copied into your scenario list where it can be opened as your own scenario.
- A scenario can be shared with another user by clicking the Share button then entering in the email address for the user you wish to share it with. Note that this must be the email they have used to register their account with at https://breedcowdynama.com.au the shared scenario will appear in their scenarios list for the relevant program.
Example one: Purchasing PTIC cows for trading
Copy the example scenario (Purchase of PTIC cows for trading) from the examples list and open the scenario, this will illustrate how the program may be used in the following example.
Note: The yellow cells are for inputs and can be adjusted, while the rest are calculated outputs.
The Cowtrade program allows for the input of Standard weight of one Adult Equivalent and Extra Adult Equivalents for cow weaning a calf, the default values being 455kg and 0.35 respectively, see figure 2. One Adult Equivalent is a non-lactating animal of average 455kg liveweight carried for a year. It is generally unnecessary to change these values unless the user is using a different Adult Equivalent convention for comparing grazing pressure and they wish to tailor it to their requirements. If the analysis period is less than the duration of pregnancy plus five months, a proportional value for the adult equivalent rating of the calf is calculated.
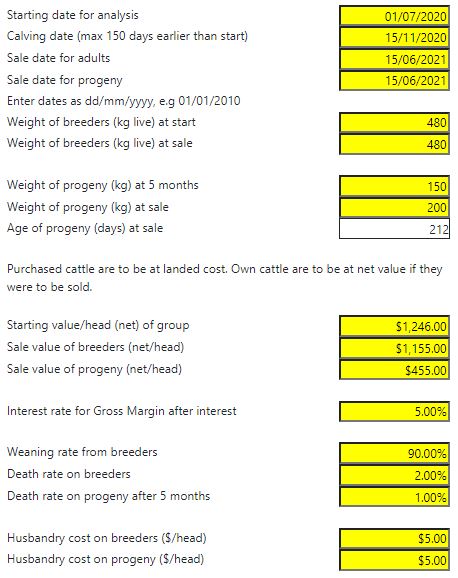
Example one describes pregnancy tested in calf (PTIC) cows being purchased early in July and sold in June of the following year. The calves have an average birth date of November and are to be sold as weaners through the local yards. Cows are to be sold to the abattoirs. The steps below take the user through the data entry displayed in Figure 3.
- Begin by entering the Start date for the analysis (usually the date the stock are purchased), Expected calving date, expected future Sale date for adults, Sale date for progeny, Weight of breeders at start and sale, Weight of progeny at 5 months and sale. Sale can be either a normal sale, or a transfer at valuation of weaner or breeder back into the herd. These dates and weights are used mainly to calculate adult equivalents.
- When entering the Starting value/head of group for purchased cattle this should be their landed value. For a destocking analysis assessing breeders already in the herd, the net value that would be achieved if that animal were to be sold should be used, there are calculators in the Cowtrade program which will help the user calculate these values, they are located below the scenario summaries in the web page.
- Sale values may be entered as per head net values, or may be calculated from weights, price per kilogram and selling and transport costs using the calculators at the bottom of the web page. Explanation and examples for the use of the calculators can be found in the Cowtrade calculators page.
- Enter the Interest rate for Gross Margin after interest, this should be viewed as the opportunity cost, especially if using business funds rather than borrowed funds.
- Enter the appropriate Weaning rate from breeders and Death rate on stock classes.
- Enter expected Husbandry cost for the stock classes based on the duration of the analysis.
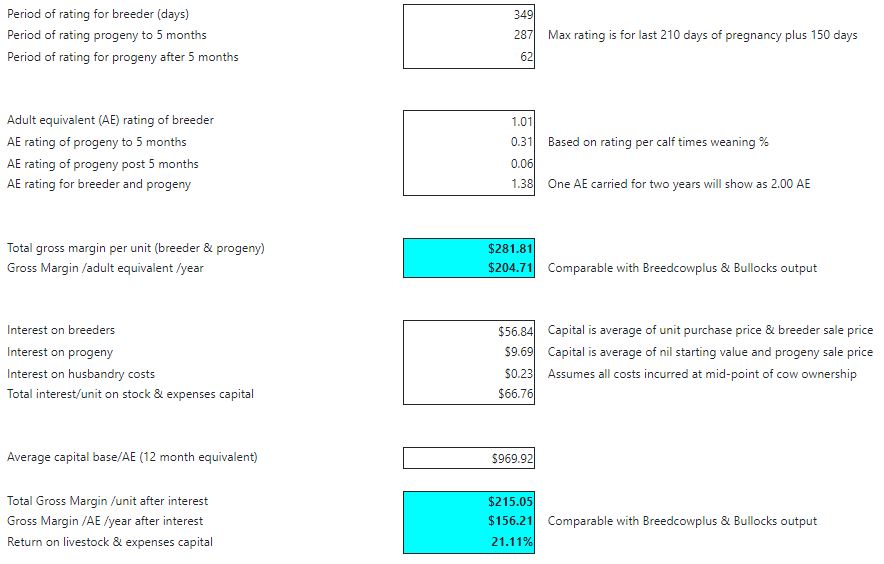
The results of the analysis, as displayed in Figure 4, can be found to the right of the yellow input cells and summarised in a column below the inputs section on the web page. The results can be saved by clicking the Save button at the bottom of the summary column and renamed by typing in the yellow box beside description of the group.
The results calculated include adult equivalent ratings for breeder and progeny over the time held, and gross margin (per unit, per adult equivalent, and as a percent of livestock and expenses capital). The results of the example indicate the purchase of PTIC cows has a positive gross margin (gross margin after interest is $156.21/AE/year) and may be profitable depending on what the alternative uses of the feed resource may be.
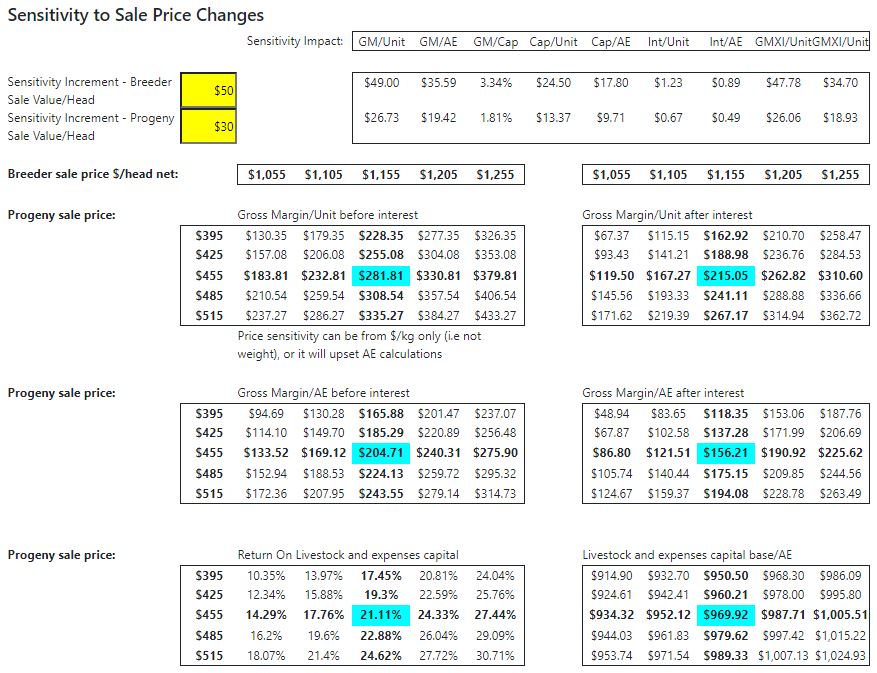
The results of the analysis can be further tested for their sensitivity to sale price increments in the section at the very bottom of the web page, below the calculators section. See Figure 5 for sensitivity tables. In the table it can be seen that small variation in the sale price of either breeder or progeny can significantly impact returns from the venture.
Example two: Assessing a drought feeding option
Copy the example scenario (Cowtrade drought feeding cows and calves) from the examples list and open the scenario, this will illustrate how the program may be used in example two.


