Dynama+ Dynama
Step 5 Complete the Dynama worksheet
The Dynama worksheet automatically takes values from the Dynama+ AECalc, Prices and Huscosts worksheets and combines them with data about births, losses, sales and purchases to build a ten year sequence of livestock schedules.
A livestock schedule (Dynama HERD TABLE 7) provides a snapshot of the structure and productivity of a cattle herd for up to a decade.
Once the performance of the cattle business has been identified in the livestock schedule, the Dynama worksheet connects its cattle trading outcomes to cost, asset and loans input to project cash flow, net income, debt and net worth.
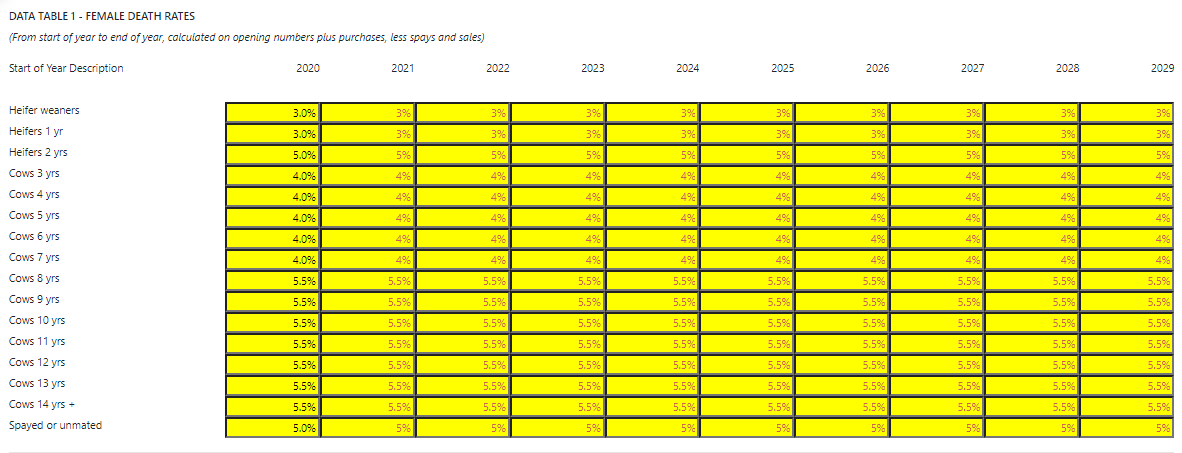
Data Tables 1 to 6 - Deaths, Calving and Prices
The first four data tables in the Dynama worksheet only require entries for the first year if values are expected to remain the same over time. Year one are normal data entry cells (black text). Years two to ten are automatically generated (red-brown text) and allow new entries to be over typed. These formulas copy the initial values to the second and subsequent years in each table but may be overridden with value entries if later years are expected to have different values to the first year.

Re Data Table 3 – Weaning Rates: The weaning rate on "Cows mated 1 year" is based on the number of calves counted as weaned from "Heifers 1 year" as per the start of year description. Actual mating for those weaners may have been early in the current budget year, or in the previous budget year. Weaning rate for each age group of breeders is multiplied by eligible breeders in that group to determine "new calves" produced for the budget year.
Purchase prices shown in Table 4 of the Dynama worksheet should be entered so that they include (on a per head basis) all of the costs associated with purchasing the cattle unless such costs are not separable from the general property costs that will be entered later in the worksheet as part of fixed or overhead costs.
Data tables 5A and 6A are female and male sale prices that are taken directly from the Prices worksheet. Any desired changes to the values shown in these tables are best made in the Prices worksheet. Tables 5B and 6B (to the right of Tables 5A and 6A), are opening inventory values. Closing inventory values are taken off the opening values of the next year. Prices for “new calves” are to set sale prices only. “New calves” will have their closing values set off the opening values for heifer and steer weaners for the following year.
As the role of inventory values is to provide an estimate of the asset value of the overall herd, not just the sale cattle, inventory values can be altered if the sale prices are not an accurate representation of overall group values. These values are used to determine herd value and to calculate net income. To change an inventory value in Table 5B or 6B, override the formula with the desired value.
Inventory values of bulls almost certainly should be changed to reflect the paddock value of the total group of cattle, not just the sale value or purchase price. The inventory value for bulls should be somewhere between the cull price and the average purchase price.
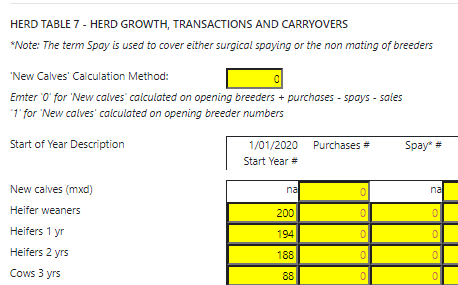
Herd Table 7 - Herd Growth, Transactions and Carryovers
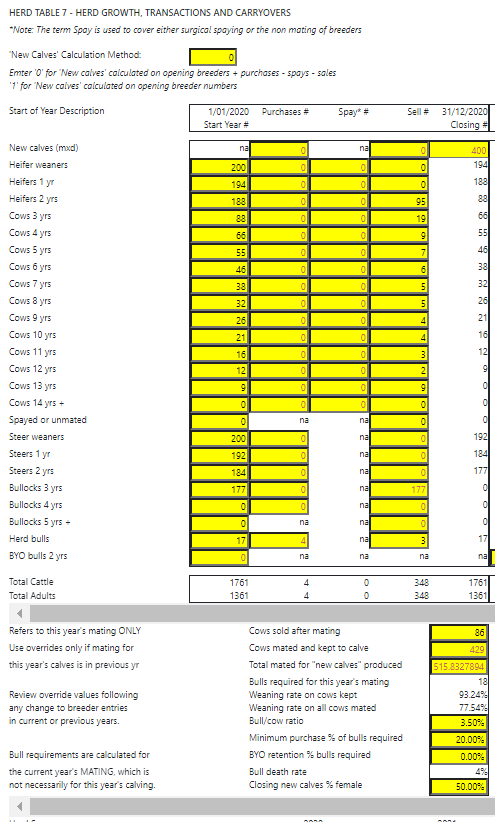
Table 7 is the livestock schedule that underpins the Dynama+ program. It takes the opening number for each class of cattle for the year, adds purchases, deducts sales, transfers spays out of the breeder groups then calculates deaths, new calves, and closing numbers.
Required entries to complete the livestock schedule for year one include:
- opening numbers for each class of livestock (at the beginning of year one)
- purchases
- spaying, and
- sales
The closing numbers from year one become the opening numbers for the next age group the following year. The year one closing numbers of new calves is divided between weaner heifers and steer weaners in the opening numbers of year two.
The number of new calves can be calculated either from the opening number of breeders plus purchases less females spayed or set aside and sales or from just the opening number of breeders.
The closing number of new calves equals calves produced by the breeder herd plus calves purchased minus calves sold. This calculation may be overridden with a numeric entry if actual numbers are being entered in the budget in place of the calculated figures.
The livestock schedule shown in Table 7 allows the female herd to be split up into two age groups for heifers (one and two year old heifers) and twelve age groups for older breeding females (years three to thirteen and then all females fourteen years and older in age).
The number entered for Cows sold or spayed after mating is calculated by adding up the total number of females sold and taking away the sales number for one year old heifers as they were not mated and taking away the number for ten year old cows as they were also culled and not mated.
If herd data is imported from a Breedcowp+ file, the number of cows sold after mating is automatically transferred to the first year of HERD TABLE 7.
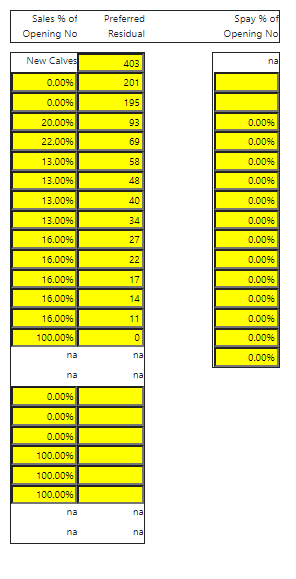
Where the Import Autosales option is used to set up a sales and culling strategy across all years, the numbers of stock sold out of HERD TABLE 7 are based on the percentage values entered in the AutoSales table located to the far right of Table 7 in the Dynama worksheet. They are rounded to whole numbers.
Quite often when building a livestock schedule for a northern Australian breeding property, the numbers in each age group of male cattle and heifers on hand will be known but the age breakup for the breeding herd is unlikely to be accurately known. The best estimate of the split up of the breeding herd into age groups can be used as a starting point and varied later if necessary. Modelling the herd in Breedcow+ first and then transferring the values to Dynama+ - as has been done in the examples provided - will also provide an approximate breakup of the female herd into age groups that can then be adjusted where necessary.
Purchases in extensive northern Australian breeding herds will most commonly be bulls but other purchased livestock need to be identified and added to the relevant classes in Table 7 of the Dynama worksheet where necessary. They are entered in the purchases column of Table 7 in the year in which they are purchased.
Spaying can be surgical or it can mean keeping surplus cows separated from bulls. Cows shown as spayed or surplus in Table 7 will transfer out of their age groups into the spayed and surplus cow group. For all fourteen year old cows and all five year old bullocks, formulas are set to automatically sell 100 percent of the number on hand at the start of the year.
Deaths are calculated in Table 7 on the opening numbers plus purchases less spays and sales. Spayed cow deaths in Table 7 are based on the opening number shown plus new spays minus sales. This assumes that sales occur early in the year. If some deaths are expected before sales, these may be factored in as negative entries in the Purchases column (with purchase price set to zero). The use of this “dirty” approach to calculating deaths should be noted on the Memo and any printouts should be corrected by hand with Deaths written over the top of Purchases.
AutoSales and AutoSpay
Sales and spays can be made by manual entry or by formula. The formulas that set the rate of sales or spaying refer to an input block located at the far right of Table 7. In that input block the percentage of livestock sold from each class of cattle or the absolute number to be sold can be set. These inputs for sales and spays are known as AutoSales or AutoSpay values and are set to zero until they are changed.
The AutoSales and AutoSpay feature of Dynama+ can be useful in setting herd targets identified in the herd modelling undertaken in the Breedcow+ program. The herd structure modelled in Breedcow+ can be transferred as a sales and spaying target to the AutoSales and AutoSpay input table. This facilitates the transition from the current herd structure to the desired herd structure within the livestock schedule of Table 7.
The balance of numbers across the years can be checked by looking at the overall numbers for adult equivalents, sales, new calves and purchases calculated for each year of the livestock schedule and shown at the bottom of Table 7 in the Dynama worksheet.
Whilst AutoSales will largely automatically transition a herd from the current structure to the AutoSales structure, the transition will occur sooner with some manual intervention in the first few years. A useful trick is to adjust breeder sales to achieve the required number of new calves as quickly as possible – since the new structure will all flow from this number of calves.
The number for new calves at the head of the Preferred Residual column in the AutoSales input block is the number generated in the Breedcow+ file used as the basis for the AutoSales transfer.
Entries for AutoSales can be either the percentage of opening number that is to be sold or the number to be kept from each group (the Preferred Residual). AutoSpay entries are the percent of opening numbers to be spayed.
If AutoSales entries are made in both columns of the AutoSales data input block, sales are calculated for both entries and the larger number displayed. This allows a minimum cull to occur in those years when opening numbers are less than the preferred residual.
For example if AutoSales entries are 5 percent and the number 500, and the opening number for the class of cattle is 600, sales are 100 (600-500) as the figure nominated for the AutoSales percent would only sell thirty cows (5 percent of 600) giving a residual of 570. If the opening number were only 400, sales will be 20 (5 percent), despite the opening number being less than the preferred residual.
AutoSales transfers from Breedcow+ combine sales before and after mating and females spayed to calculate the “desired residual” or the percentage “sale” of opening numbers for each female group. These are the numbers in the AutoSales table. In the livestock schedules for each year, sales and spays are again separated. Sales equal total disposals less spays. Overriding a spay number with another value will see sales change to maintain the same number of disposals. Overriding the sales entry will not alter the spay number. Sales calculated by AutoSales automatically reduce by the number entered in the spayed or surplus column.
The AutoSales formulas do not distinguish between sales before mating and sales after mating. If you ignore this distinction, the number of cows upon which bull requirements are calculated will be understated. To fix this, enter for each year the number of cows expected to be sold or spayed after mating. This is the first entry in the small block of data beneath the main part of Table 7. Failure to do this will affect only the calculation of bull requirements.
Weaning rates
The weaning rates used to calculate new calves (or, more precisely, new weaners) are applied by default to the number of breeders mated and kept. The correct entry for weaning rate therefore depends on whether empty cows have or have not been removed. A pregnancy rate of 80 percent and pregnancy survival to weaning of 90 percent would result in a 72 percent weaning if the empties stayed in the herd. If the empties were removed, the weaning rate would be 90 percent. Other combinations are possible, such as removal of some of the empties or the selective sale of PTIC (pregnancy tested in calf) breeders.
If changing the breeder sales strategy is going to alter the weaning percentage on cows mated and kept, then the weaning rate shown in Table 3 of the Dynama worksheet should be adjusted.
Managing bulls numbers
Bull purchases, the number of male weaners retained for BYO (breed your own) bulls and sales are determined in all years by unprotected allow override formulas.
If the number of new calves is calculated from cows on hand after purchases, sales and cows spayed, the bull requirements are for this year’s mating to produce this year’s calving . If the number of new calves is calculated from opening breeders only, the bull requirements calculated will be for this year’s mating to produce next year’s calves.
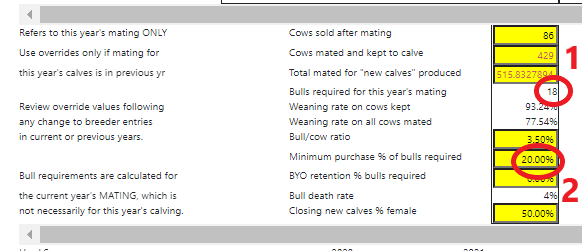
Bull purchase, sale and BYO numbers are determined by the percentage entries shown below Table 7 in the Dynama worksheet. Entries are for the bull/cow ratio (as a percent), minimum purchases (percent of bulls required), the retention of BYO bulls (percent of bulls required) and bull death rate (as a percent).
The minimum bull purchase percent and BYO retention percent are proportional to total bulls required. Start with the proportion expect to be replaced and then apportion it between purchases and BYO (home bred) bulls.
The numbers for cows spayed or sold after mating also shown beneath Table 7 in the Dynama worksheet is used to ensure a full count of cows mated and thus of bulls required. It refers to this year’s mating, whether that mating produces this year’s calves or next year’s. If cows are purchased as mated, a negative entry in the cows sold or spayed after mating input cell will ensure that bulls are not provided for those females, or simply override the formulas with your own calculation.
The bull/cow ratio is used to calculate the bull requirements for this year’s mating. A minimum rate of replacement of bulls is provided by the entry against minimum purchase percentage of bulls required. Retention of Breed-Your-Own (BYO) bulls is provided for by the entry against BYO retention percent bulls required.
The bull purchases will be calculated as the greater of two numbers – the number required to provide the required number of bulls (1) or the minimum purchase number (2).
The formulas for BYO retentions, purchases and sales may be overridden with numeric entries. The bull sales formula ensures that the number required is always there. Indeed, if the purchases formula has been overridden and enough bulls are not provided, the sales formula will compensate by showing negative sales. To fix the problem it is necessary to increase purchases, retain more BYO bulls, reduce the bull/cow ratio or override the sales formula.
Allow override formulas reference the previous year’s values for bull requirements and automatically transfer them from year two to through to year ten.
BYO (breed your own) bulls are treated as part of the steer group until transfer into the breeding bull herd at age two years (when last year’s closing number of one year olds becomes this year’s opening number of two year olds).
Identifying the opening number of cows
The number shown as the number of cows mated and kept to calve will be either the opening breeder number (if calculating new calves on that basis) or the opening number of breeders plus purchases less sales and females spayed. If the latter number is being used, and some of these sales have occurred after calving, the calculated number will be wrong and should be overridden with the correct number. This number affects only the display of weaning rate on cows kept.
The cell for total cows mated will display a value only if the number of new calves is calculated on opening breeders plus purchases less sales and females spayed. The total number of cows is calculated as the number of cows mated and kept to calve plus the number of cows sold or spayed after mating (which can include cows sold after calving).
If the number of new calves is calculated on the opening breeder numbers, the value for total cows mated will display a message “Enter Total”. The value for weaning rate on all cows mated will display “Needs Total” if there is no numeric entry for the number of total cows mated.
The data blocks at the bottom of Table 7 of the Dynama worksheet has an input cell against the heading closing new calves’ percent female, with a default of 50 percent. This is required as new calves can be bought and sold potentially leading to an imbalance in the male to female closing inventory if purchases or sales were for a greater proportion of heifers or steers.
Steer opening numbers
The opening number of two year old steers shown in Table 7 of the Dynama worksheet will be the closing number of one year olds, less the number required for BYO bulls (which changes as breeder numbers change in response to altered sale decisions).
The link between bull requirements, female sales and the number of two year old steers available for sale means that setting sales of two year old steers to 100 percent by a numeric entry could be thrown out by any subsequent change to female sales. To avoid this happening, use the AutoSales feature if possible. Otherwise, make all female sales entries first or at least recheck two year old steer sales after any change to female sales.
Beneath Table 7 in the Dynama worksheet is the summary of adult equivalents, livestock sales, purchases, new calves and deaths for each period of the livestock schedule. The steady state herd modelled in Breedcow+ earlier in this manual has been used in the Dynama+ program as a starting point to building a long term budget. Some fluctuation in numbers occurs due to the use of the Autosales table adjusting sales over time.
Costs Table 8A - Variable and Fixed Costs
The Dynama+ program separates costs into variable and fixed costs, livestock purchases (other than cattle), family living or drawings, taxation, and capital purchases. Table 8A of the Dynama worksheet details the fixed and variable costs.
