Bullocks
Summary
The Bullocks program does for non-breeding cattle what the Cowtrade program does for breeder groups. Although the focus of the Bullocks program is on selecting the most profitable turnover cattle, it may also be used to evaluate forced sales options.
The gross margins calculated in the Bullocks program for non-breeders may be compared with the gross margin for breeders as calculated in the Cowtrade program if they are compared on a per adult equivalent after interest or capital invested basis.
The Bullocks program requires data for purchase and sale dates, weights, prices (landed and net respectively), expected mortalities, variable costs, interest rate and purchase and sale price increments for the sensitivity tables.
Using the Bullocks program
The program is located with the [Breedcow and Dynama] software, within the Tools tab, which can be accessed after registering or logging in to use the free software. The figure below displays the Bullocks scenario list page.
- A new scenario can be created by clicking the Save button beside a blank yellow name bar and can be named by typing in the yellow bar. This scenario or previously created scenarios can be edited by clicking the Open button.
- To open an example scenario click the Copy button beside the example scenario and it will be copied into your scenario list where it can be opened as your own scenario.
- A scenario can be shared with another user by clicking the Share button then entering in the email address for the user you wish to share it with. Note that this must be the email they have used to register their account with at https://breedcowdynama.com.au the shared scenario will appear in their scenarios list for the relevant program.
Entering data in Bullocks
Note that data can only be entered in the cells with a yellow background.
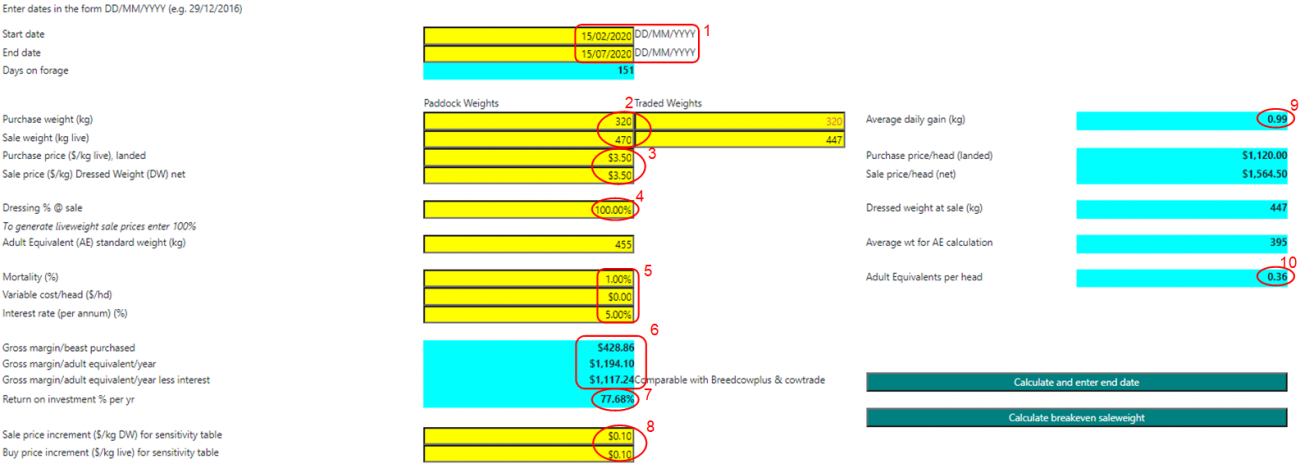
- Firstly, enter the start date and expected end date of the steer fattening enterprise. Dates are entered using the dd/mm/yyyy format.
- Next, decide the average opening and closing weights of the steers. In this case the gross margin uses the same weights for both paddock weights and traded weights. If the traded (or sale weights) are going to be significantly less than the paddock weights, then it is important to use appropriate traded weights as they are the ones used to calculate the gross margin. The traded weights are entered by default using an allow override formula but should be changed where paddock weights at sale time are different to the actual weight at the point of sale.
- Enter the purchase and sale price
- Sale weights can be specified as dressed or live weights and to specify live weights set the dressing percentage at sale value to 100 percent.
- Mortalities and variable costs are for the duration of the fattening period, not per year and the interest rate is nominated as an annual rate.
- The input data is combined to calculate the measures of gross margin per beast purchased, gross margin per adult equivalent, gross margin per adult equivalent after interest and the percent return on livestock capital. Each of these measures is adjusted to a yearly equivalent by taking into account the number of days on feed.
- The return on investment is calculated as the average of the starting and finishing value of the beast (less mortality allowance), plus half the variable cost (assuming costs are distributed evenly over the fattening period). The capital calculation for the return on investment is done on the same basis.
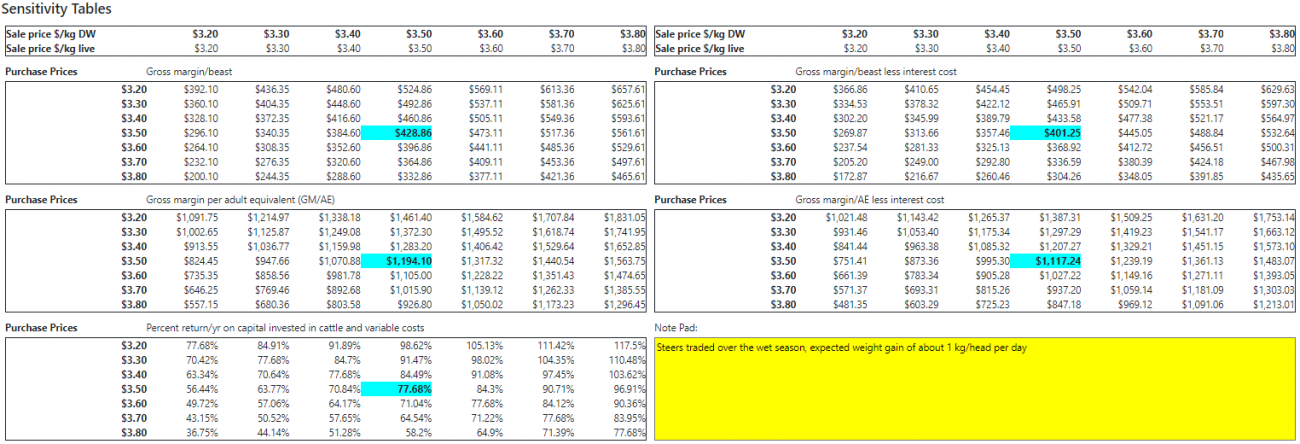
- Sensitivity tables are calculated in the Bullocks program to show the impact of a change in any of the key variables used in the analysis. The range of values shown in the sensitivity table can be set by changing their incremental change.
- By default, the Bullocks program calculates the average daily gain from the sale weight and end date entered.
- Adult equivalents are also for the duration of the fattening period and are calculated as average weight of the animal over the fattening period divided by the default adult equivalent standard (455 kg) multiplied by number of days on forage and divided by 365. Thus an animal of 455 kg or less can have an adult equivalent rating of more than 1.00 if it is on forage for more than a year.
There are calculators that can be used to estimate the landed purchase cost of steers or the net sale price per kilogram dressed for steers.
The green drill down boxes at the bottom of the calculators can be used to quickly transfer the calculated values to the main worksheet.
The sensitivity tables show the calculated values in the blue cells, surrounded by deviations from those calculations for different purchase and sale prices.
Note: The calculation of interest cost, and therefore of the gross margin after interest, is based on the average amount of capital tied up over the fattening period. This is calculated as the average of the starting and finishing value of the beast (less mortality allowance), plus half the variable cost (assuming costs are distributed evenly over the fattening period). Capital calculation for return on investment is the same.
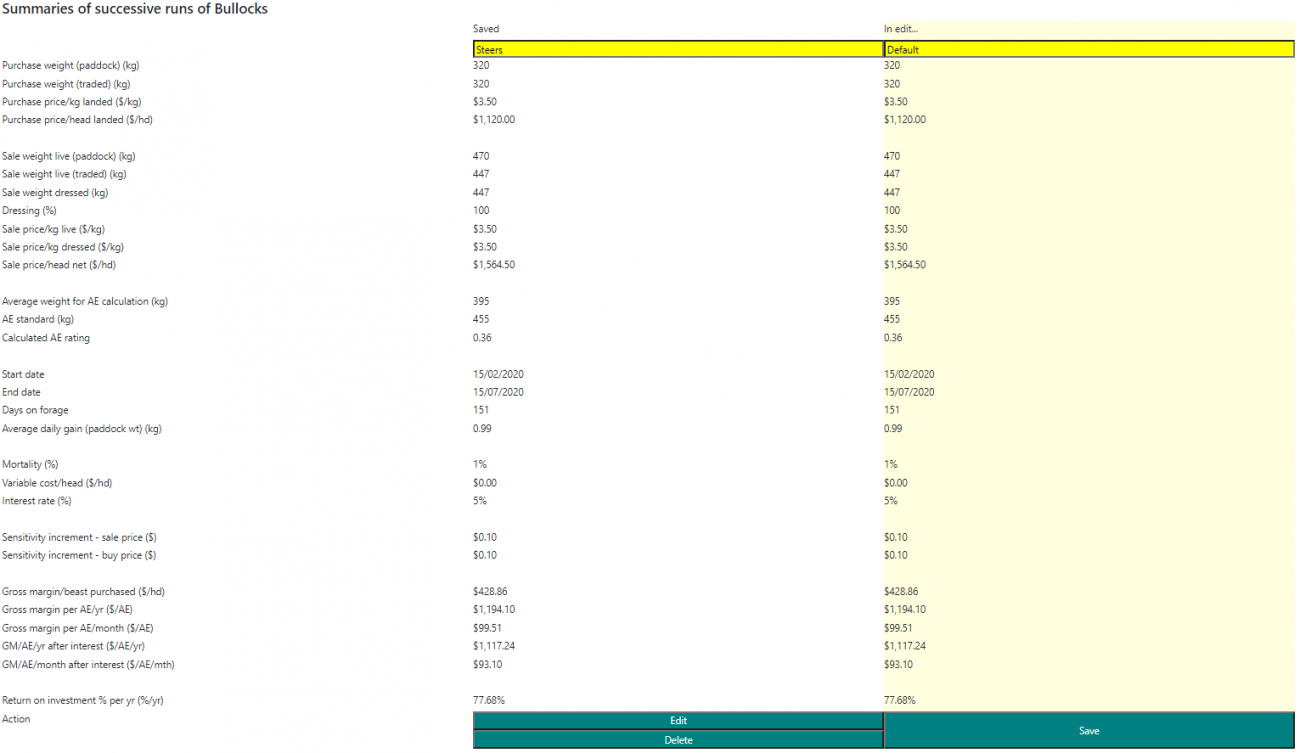
The key variables and outputs of the Bullocks program are automatically summarised by copying the values of key data from the worksheet to the summary section at the bottom of the worksheet. The current scenario can be saved and alternative herd management strategy or variables can then be summarised in sequence to capture the main difference between each scenario analysed. To make changes to any scenario, simply click "edit" or to remove a scenario click "delete".


